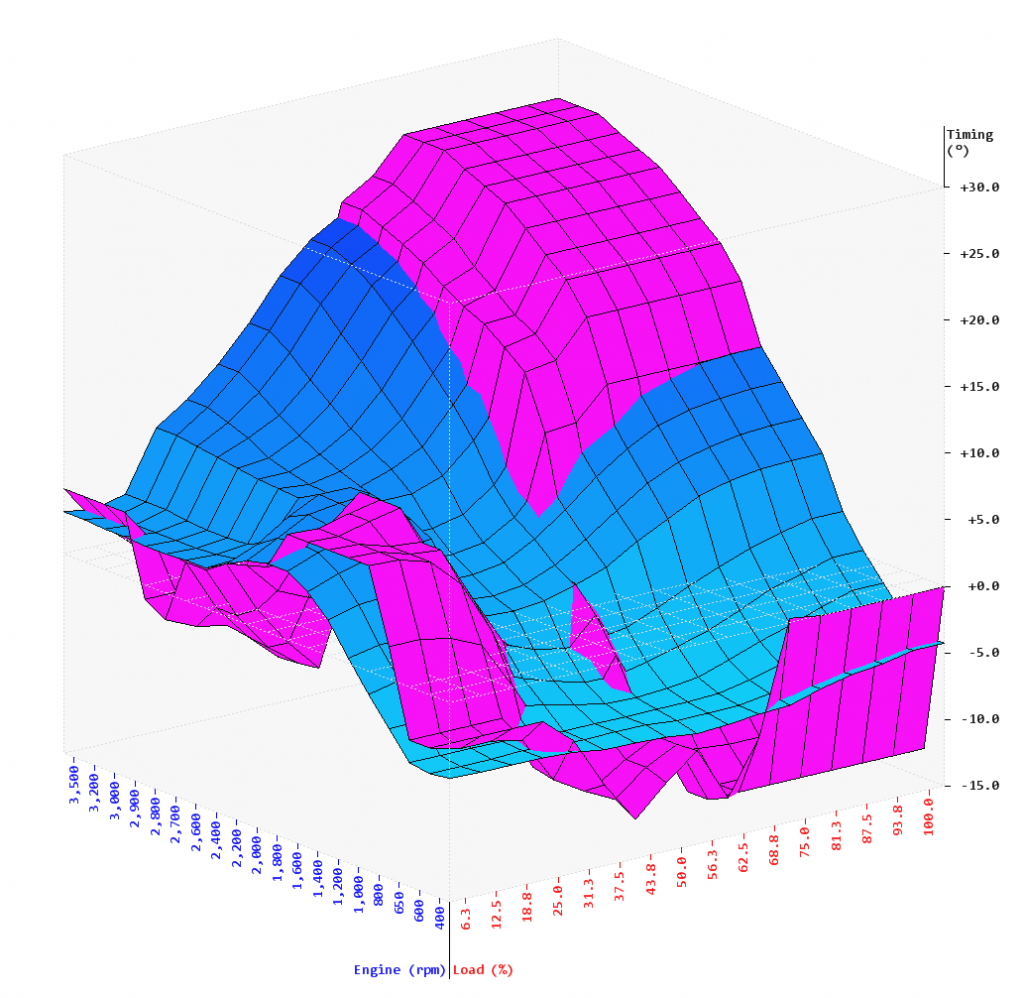
The timing map isn't based on anything, as far as the ECM is concerned. The ECM uses the figure in the map for when to start the main injection event.
The pressure and duration tables are referenced to determine the desired pulse width.
Here is an example. At 2000 rpms and 100% load the OEM tune commands a 20,885 psi. Based on the duration table (the modified labels one I posted) we know that at 100% load and 20,885 psi the pulse width is going to be a 2126us pulse. Then based on rpms we know that the crank takes 83us to go 1°, so 2126/83 is a 25.6° injection event. So when do you want to inject the fuel, lets say 50% BTC and 50% ATDC, so 25.6°*.5=12.8°. So we would put 12.8° in the timing table.
That's how timing and pressure/duration effect each other, and even thou the %age of BTDC:ATDC is the same on those two timing charts they look different. One also has to extrapolate as the duration table doesn't have all the possible pressure/load combinations.